I’ve had quite a few questions about COVID-19 put to me by friends and family members recently, and so last week I had intended to begin trying my best to answer them. This plan had to be put on hold when Waco (and various other cities in Texas) issued a requirement to wear a face mask inside of businesses and restaurants, and the whole world sort of lost it’s collective mind. I think things have calmed down now, at least locally, and as I’ve driven to clinic and back and the one or two other places I couldn’t really avoid going, I’ve thankfully seen a noticeable increase in masking, either in compliance with this decision or in response to the efforts of so many to share reliable information on the benefits and safety of wearing a face mask. Thank you all for fighting the crazy amount of misinformation out there. For my take on wearing masks you can read my previous blog post on masking.

Now that we’ve made it through another week without another viral misinformation video, I’m finally taking the time to sit down and write that original post I had planned on. I’ve tried to limit myself to just two paragraphs for each topic (paragraph length unspecified), but given just how many questions
Due to length, I’ve broken this post up into multiple parts.
Warning: These got really ‘mathy’ on me before I realized it was happening.
Part 1: Is the rise in cases just due to more testing?
Part 3: Isn’t a surge a good thing? Herd Immunity and the RECOVERY Trial.
Question #2: Do antibody testing and asymptomatic cases prove the virus isn’t as dangerous as we thought?
Asymptomatic Cases
The short answer here is, yes. And also in a very real sense… No. When antibody testing first began to confirm that a certain percentage of people contracted the virus but never developed symptoms, or had symptoms that were so mild they failed to associate them with the virus (‘weird how my allergies just acted for a couple of days’), it was great news for everyone. What it was not (and I’ve been on this soapbox for a while now) was proof that the ‘experts were wrong’ about how dangerous the virus is. I’ve been reading every model and study and expert opinion about COVID-19 I could keep up with for the past 3 months, and I cannot tell you the number of times that physicians and epidemiologists and researchers have either implied or explicitly stated that the mortality rates we were seeing from the virus didn’t account for asymptomatic and minimally symptomatic cases. I’m no expert, but I’ve typed it more times than I can count myself.

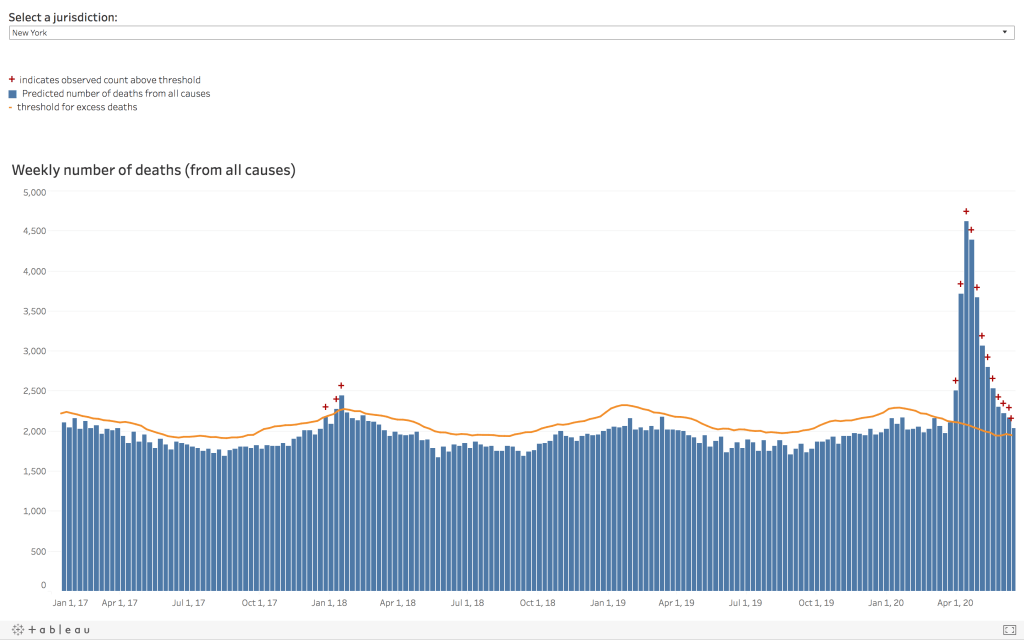
Those scientists anticipated that a certain percentage of the population would contract the virus but never develop significant symptoms, but had to work from the best numbers they had until such testing was actually available. And it’s a very good thing that those assumptions were correct, since the original case fatality rates we were seeing were in the civilization ending range of 8-15% in certain countries. If antibody testing had been developed and found only a negligible amount of asymptomatic and minimally symptomatic cases, it would be devastating news for everyone; not least for the doctors, nurses, epidemiologists, and others who have turned their lives upside down to fight the pandemic. Accounting for asymptomatic and minimally symptomatic cases would clearly yield a much lower death rate, but still firmly in the very, very dangerous range. For instance, large scale antibody testing in New York in April found antibodies in 13.9% of the population (WBUR has an excellent article picking through the wildly varied estimates of asymptomatic cases) , which reduced their overall estimated fatality rate from 6% to 0.5%. Many current estimates place the overall fatality rate between 0.5% and 1.3%. For a virus this contagious, these are still scary numbers. Even here at the end of June, many people are still wanting to compare this to the flu to dismiss the danger, even though these much lower death rate estimates are still 5 to 13 times higher than seasonal influenza’s commonly accepted 0.1% fatality rate, and even though the flu itself regularly threatens to overwhelm our healthcare systems. Please keep in mind that this is at best an apples and oranges comparison. We don’t routinely measure influenza antibodies to determine the percentage of asymptomatic cases, focusing instead on those who are symptomatic, and our death rates for flu are based on a totally separate set of calculations (I talked about this in more detail in my response to the Bakersfield Urgent Care doctors). If you want to compare oranges to oranges we can look at excess mortality for both viruses. Consider the graph below from New York State: the first cluster of red crosses is the peak of the 2017-2018 flu season, the worst flu season I have experienced since starting medical school; the second is COVID-19 during New York’s surge in April.
Before we move on from asymptomatic cases, we need to mention two more things. First, while knowing the overall infection fatality rate including data from those who never had significant symptoms is great from an epidemiology standpoint, it doesn’t mean that the case fatality rate for people with symptoms is a ‘fake number’ or falsely elevated. If you develop symptoms and test positive for the virus, and especially if you end up in the hospital, it would be small comfort to know that some people didn’t get sick from it at all. We still need to know what the specific risk is for people with symptoms, and for people with severe symptoms, in order to properly counsel those patients and to inform our medical response. Second, asymptomatic cases are a double edged sword; yes, it means that some people will become immune without actually getting sick themselves, but it also means that some people can spread the virus without ever knowing they’ve had it. We all need to exercise caution even if we don’t have a cough and fever.

Antibody Testing
One of the problems in determining a final overall death rate (besides the fact that we are still in the middle of the pandemic) is the accuracy of antibody testing, since we have to rely on this to tell us how many people had the virus and were either asymptomatic or didn’t get tested for it at the time. And this in turn relies on something called the positive predictive value, how likely it is your ‘positive’ test result has really detected the antibodies, which depends both on how well the antibody tests are designed (and their not being fake, which is apparently a problem now as well), but also on the prevalence, or in this case cumulative incidence, of the virus. The higher the percentage of people who have actually had the virus, the more likely it is that a positive test really represents a true positive and not a laboratory error. It’s a relatively simple concept, but honestly it’s just unintuitive enough that I’ve struggled with it myself for years. Basically, every lab test has some degree of error; sometimes these tests will tell you that you have the antibodies when you don’t, and sometimes it will tell you that you don’t have them when you really do. The more rare the virus has been in your area, the more likely that your ‘positive’ test was the result of such an error instead of actually having the antibodies. Carry this to the logical conclusion; if you brought an antibody testing system back in time to last Summer when nobody had SARS-CoV-2 antibodies, or for that matter back to Medieval England, you would still have some tests turn positive; but they would clearly all be from laboratory error because the prevalence of the disease then would have been 0%. When doing these tests, we cannot ignore the importance of how common or rare the virus has been in the region where we are testing.

Calculating positive predictive value based on prevalence can be done with just a few numbers (test sensitivity, test specificity, and prevalence) and the simple equation PPV = (sensitivity x prevalence) / [ (sensitivity x prevalence) + ((1 – specificity) x (1 – prevalence)) ] (Um, there’s also an online calculator if you’d rather follow along that way), and it’s always shocking to me how quickly the lab error for even very good tests becomes relevant when the prevalence of a disease is low. Most manufacturers rate their antibody tests in the extremely accurate range of 95-100% for both sensitivity and specificity (because of course they do); some have performed well in independent testing, but others not so much. Let’s use the online calculator (or the equation above, if you just really like that sort of thing) and plug in a few of these numbers.
- Scenario 1: Post-Surge New York City, excellent quality antibody test.
- Let’s say you never definitively got diagnosed with COVID-19 during the surge in New York, and wanted to get an antibody test to see if you have already had it and are immune.
- Sensitivity: 95% (.95)
- Specificity: 95% (.95)
- “Prevalence”: 20% (.2)
- Results: Positive Predictive Value = 82.6%
- This means if you get a positive results from this very accurate test done after your city has survived a severe surge, there’s still about a 17% chance you don’t actually have the antibodies after all.
- Let’s say you never definitively got diagnosed with COVID-19 during the surge in New York, and wanted to get an antibody test to see if you have already had it and are immune.

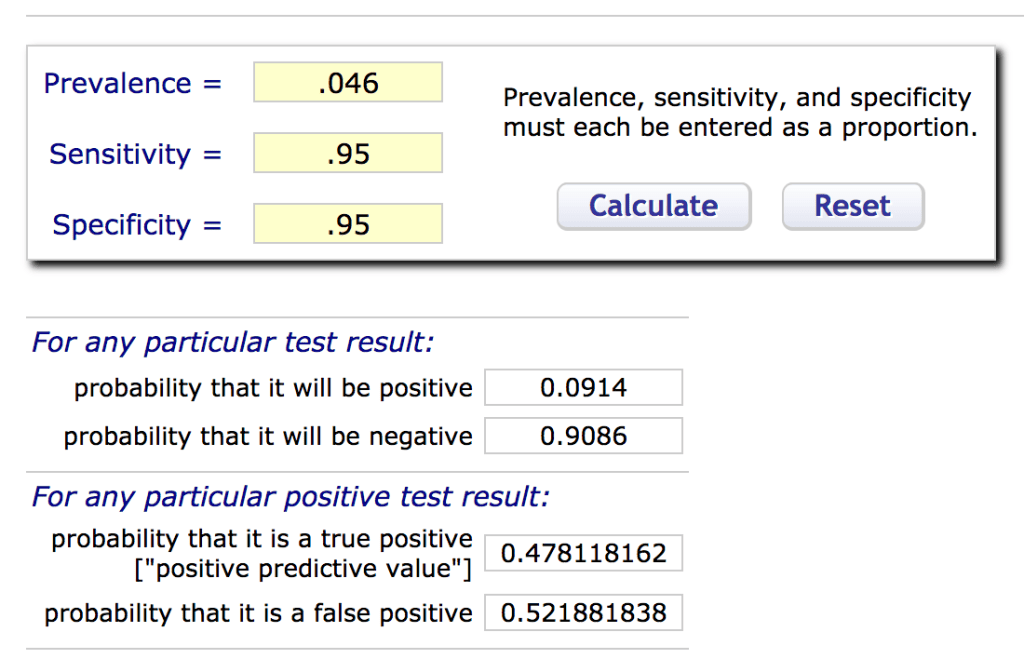
- Scenario 2: Pre-Surge Texas, excellent quality antibody test.
- Now let’s say you had the antibody test done a few weeks ago here in Texas, again with a test that has excellent accuracy.
- Sensitivity: 95% (.95)
- Specificity: 95% (.95)
- “Prevalence”: 4.6% (0.046)
- Results: Positive Predictive Value = 47.8%
- With a lower prevalence, a positive antibody test on the same machine is now about the same as a coin toss.
- Now let’s say you had the antibody test done a few weeks ago here in Texas, again with a test that has excellent accuracy.
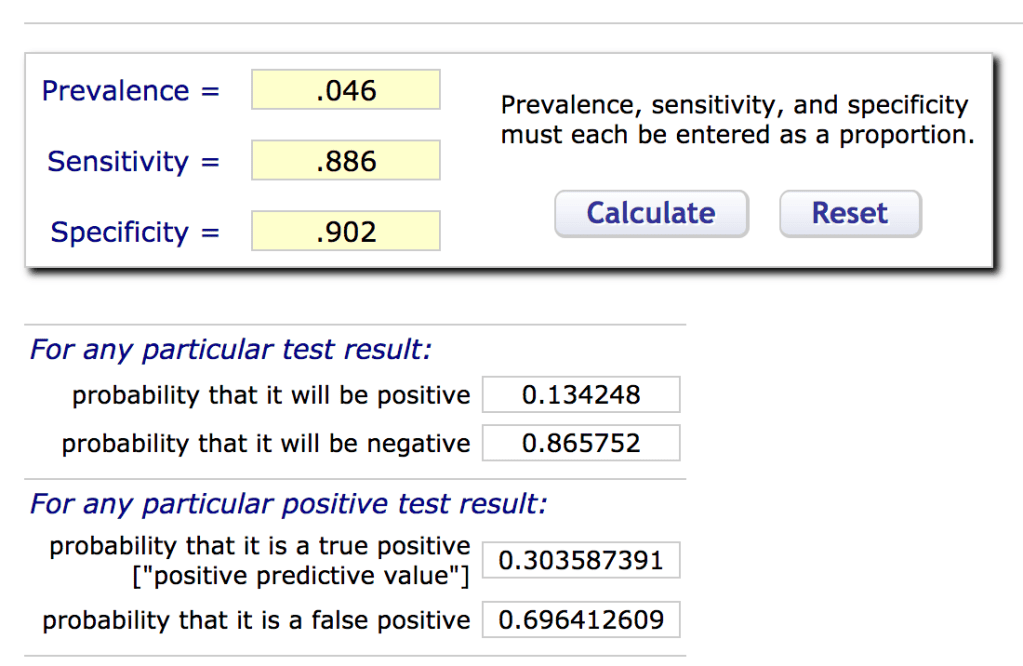
- Scenario 3: Pre-Surge Texas, sub-par antibody test.
- Same scenario as the last, but the quality of the test isn’t quite as good as the manufacturer funded studies seemed to promise.
- Sensitivity: 88.6% (.886)
- Specificity: 90.2% (.902)
- “Prevalence”: 4.6% (0.046)
- Results: Positive Predictive Value = 30.4%
- At this point you are probably better off just switching the ‘positive’ and ‘negative’ labels on the readout…
- Same scenario as the last, but the quality of the test isn’t quite as good as the manufacturer funded studies seemed to promise.
Now, savvy statisticians will note three things in looking at the above numbers and playing around with the data. The first is that I’ve used the very antibody testing methods I’m questioning to fill in the prevalence, which is itself part of my calculations. Figuring out the real prevalence is a complex problem epidemiologists are still trying to solve; this is a simplification for illustrative purposes. But more importantly, you will notice that as the prevalence goes down so does the likelihood that a positive test was really positive; in fact, it drops quite precipitously, especially as you get below 5%. However, as the specificity– the likelihood that the test correctly calls a negative result negative– approaches 100%, the number of false positives actually drops to 0. If we want to make sure we never tell someone they are immune when they aren’t, we need a very high specificity; but because no test is truly perfect, this will mean some sacrifices in actually being able to detect the antibodies when they are there, which hurts our ability to accurately estimate the number of asymptomatic cases. To get a perfect specificity, you will lose some sensitivity, and vice versa; the right balance depends on what you intend to use the test for.
So all of that to say, when that antibody test you got comes back positive and the manufacturer says their test is “95% accurate,” you may be tricked into thinking it means there’s a 95% chance you really have already had the virus and now have antibodies against it. But they are only telling you half the story, and you either need access to some more data to make your calculations and determine the real positive predictive value, or at the very least you need to take it with a grain of salt and still exercise caution; especially if your area hasn’t actually had anything like a true surge yet. After all, only a great fool would accept what he was given, and you are not a great fool.